編輯:關於Android編程
MPAndroidChart是一款基於Android的開源圖表庫,MPAndroidChart不僅可以在Android設備上繪制各種統計圖表,而且可以對圖表進行拖動和縮放操作,應用起來非常靈活。MPAndroidChart顯得更為輕巧和簡單,擁有常用的圖表類型:線型圖、餅圖、柱狀圖和散點圖。
歡迎大家吐槽,小弟初來炸到,這是本人寫的第一篇博客,希望大家多提意見,不勝感激
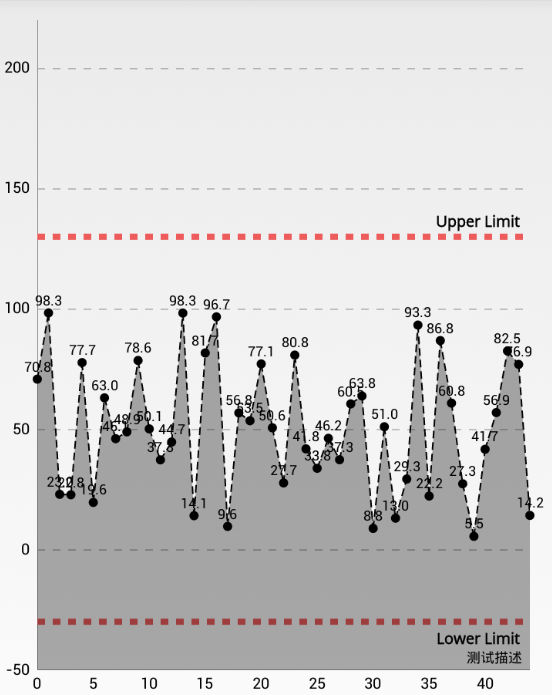
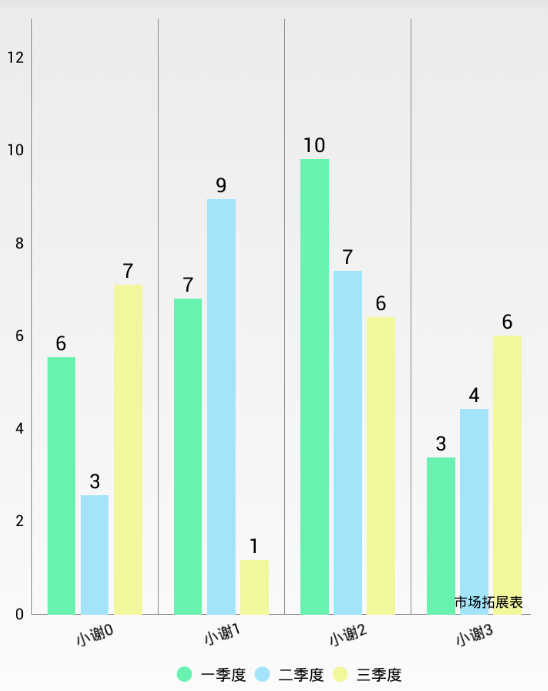
BarChart
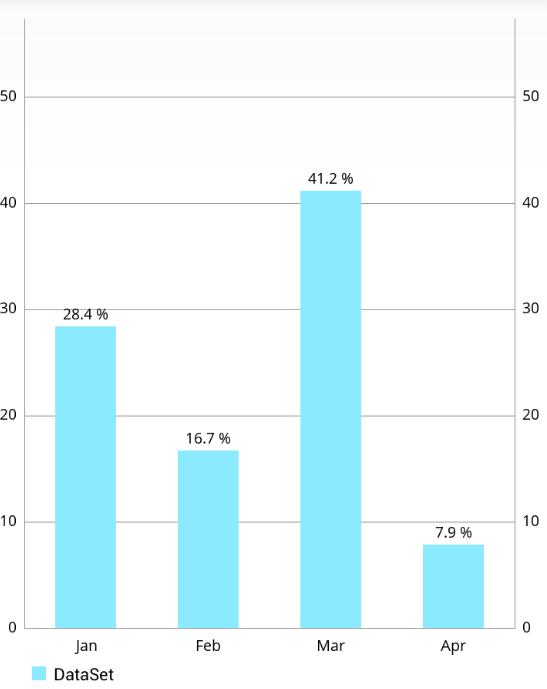
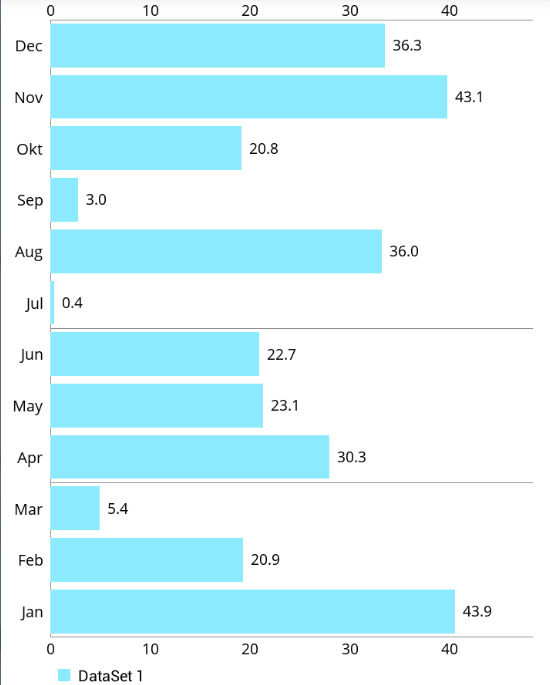
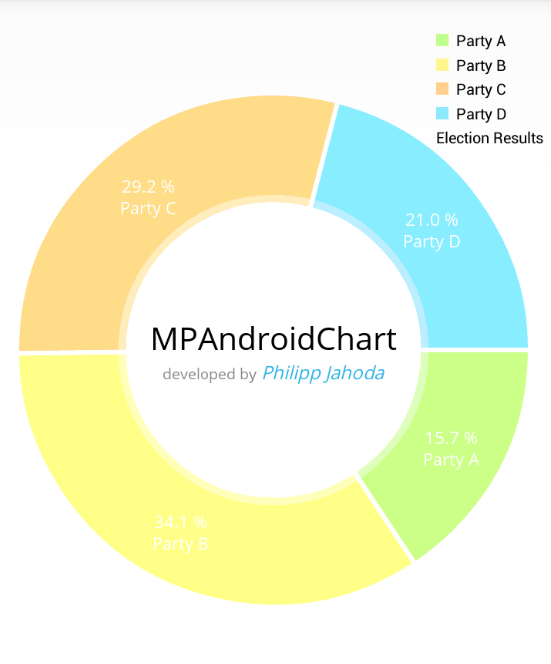
PieChart
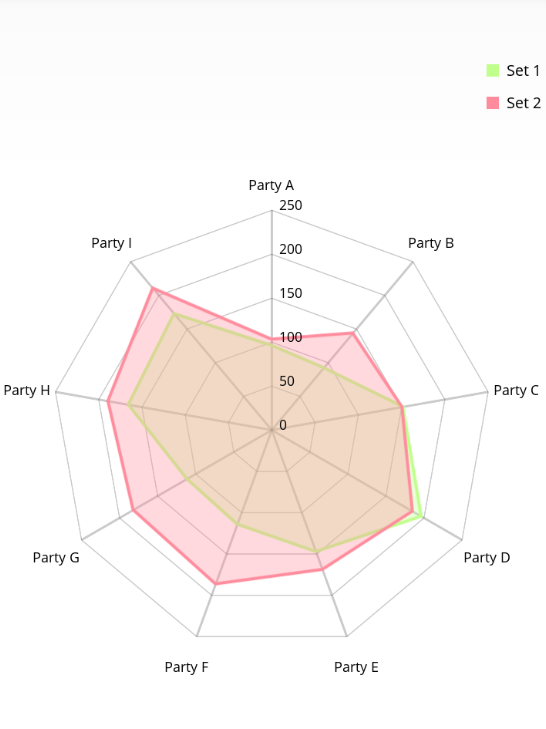
 RadarChart
XY軸的繪制
setEnabled(boolean enabled):設置軸是否被繪制。默認繪制,false不會被繪制。 setDrawLabels(boolean enabled):設置為true打開繪制軸的標簽。 setDrawAxisLine(boolean enabled): 設置為true,繪制軸線 setDrawGridLines(boolean enabled): 設置為true繪制網格線。定義軸線樣式
setTextColor(int color): 設置軸標簽文本顏色。 setTextSize(float size):設置軸標簽的字體大小。 setTypeface(Typeface tf):設置軸標簽的自定義Typeface(Typeface.createFromAsset(getAssets(), “字體文件名”);) setGridColor(int color): 設置網格線顏色。 setGridLineWidth(float width):設置網格線寬度。 setAxisLineColor(int color):設置此軸的坐標軸的顏色。 setAxisLineWidth(float width): 設置此軸的坐標軸的寬度。 setVisibleXRangeMaximum(float maxXRange):設置x軸最多顯示數據條數,(要在設置數據源後調用,否則是無效的) enableGridDashedLine(float lineLength, float spaceLength, float phase): 顯示網格線虛線模式,”lineLength”控制短線條的長度,”spaceLength”控制兩段線之間的間隔長度,”phase”控制開始的點。圖表交互設置
setTouchEnabled(boolean enabled): 允許你打開或者關閉與圖表的所有觸摸交互的情況。 setDragEnabled(boolean enabled): 打開或關閉對圖表的拖動。 setScaleEnabled(boolean enabled):打開或關閉對圖表所有軸的的縮放。 setScaleXEnabled(boolean enabled): 打開或關閉x軸的縮放 setScaleYEnabled(boolean enabled): 打開或關閉y軸的縮放。 setPinchZoom(boolean enabled): 如果設置為true,擠壓縮放被打開。如果設置為false,x和y軸可以被單獨擠壓縮放。 setHighlightEnabled(boolean enabled): 如果設置為true,在圖表中選中觸屏高亮。 setHighlightPerDragEnabled(boolean enabled): 設置為true時允許高亮顯示拖動結束的對象在縮放到最下時。默認:true setHighlightIndicatorEnabled(boolean enabled): 如果設置為true, 指標線(或桿)將展示被選擇的線的繪制的值。 自定義軸線的值
BarCharts.java
package com.charts.xh.mpandroidcharts;

import android.app.Activity;
import android.content.Intent;
import android.graphics.Color;
import android.os.Bundle;
import android.util.Log;
import android.widget.Toast;

import com.charts.xh.mpandroidcharts.com.charts.xh.utils.CustomerValueFormatter;
import com.charts.xh.mpandroidcharts.com.charts.xh.utils.MyYValueFormatter;
import com.github.mikephil.charting.charts.BarChart;
import com.github.mikephil.charting.components.Legend;
import com.github.mikephil.charting.components.Legend.LegendForm;
import com.github.mikephil.charting.components.Legend.LegendPosition;
import com.github.mikephil.charting.components.XAxis.XAxisPosition;
import com.github.mikephil.charting.components.XAxis;
import com.github.mikephil.charting.components.YAxis;
import com.github.mikephil.charting.data.BarData;
import com.github.mikephil.charting.data.BarDataSet;
import com.github.mikephil.charting.data.BarEntry;
import com.github.mikephil.charting.data.Entry;
import com.github.mikephil.charting.highlight.Highlight;
import com.github.mikephil.charting.interfaces.datasets.IBarDataSet;
import com.github.mikephil.charting.listener.OnChartValueSelectedListener;

import java.util.ArrayList;

public class BarCharts1 extends Activity implements
        OnChartValueSelectedListener {

    private BarChart mChart;

    @Override
    protected void onCreate(Bundle savedInstanceState) {
        super.onCreate(savedInstanceState);
        setContentView(R.layout.activity_barchart);
        mChart = (BarChart) findViewById(R.id.chart1);
        mChart.setOnChartValueSelectedListener(this);
        mChart.setDescription("市場拓展表");
        mChart.setNoDataTextDescription("You need to provide data for the chart.");
        mChart.setDrawValueAboveBar(true);//將Y數據顯示在點的上方

        // mChart.setDrawBorders(true);

        // scaling can now only be done on x- and y-axis separately
        mChart.setPinchZoom(true);//擠壓縮放

        mChart.setDrawBarShadow(false);
        mChart.setDrawGridBackground(false);
        mChart.setScaleYEnabled(false);
        mChart.setDoubleTapToZoomEnabled(false);//雙擊縮放
        mChart.getXAxis().setPosition(XAxisPosition.BOTTOM);//x軸位置
        // create a custom MarkerView (extend MarkerView) and specify the layout
        // to use for it
        //自定義   MarkerView
        MyMarkerView mv = new MyMarkerView(this, R.layout.custom_marker_view);

        // define an offset to change the original position of the marker
        // (optional)
        // mv.setOffsets(-mv.getMeasuredWidth() / 2, -mv.getMeasuredHeight());

        // set the marker to the chart
        mChart.setMarkerView(mv);
        Legend l = mChart.getLegend();//圖例
        l.setPosition(LegendPosition.RIGHT_OF_CHART_INSIDE);
        l.setTextSize(10f);
        l.setFormSize(10f); // set the size of the legend forms/shapes
        l.setForm(LegendForm.CIRCLE);
        l.setWordWrapEnabled(true);
        l.setPosition(LegendPosition.BELOW_CHART_CENTER);

        XAxis xl = mChart.getXAxis();
        xl.setLabelRotationAngle(-20);//設置x軸字體顯示角度
        //xl.setPosition(XAxisPosition.BOTTOM);


        YAxis leftAxis = mChart.getAxisLeft();
        //leftAxis.setValueFormatter(new LargeValueFormatter());//
        leftAxis.setValueFormatter(new MyYValueFormatter());//自定義y數據格式化方式
        leftAxis.setDrawGridLines(false);//是否畫線
        leftAxis.setSpaceTop(30f);
        leftAxis.setAxisMinValue(0f); // this replaces setStartAtZero(true)
        mChart.getAxisRight().setEnabled(false);
        setData(10);
    }

    public void setData(int num) {

        ArrayList xVals = new ArrayList();
        for (int i = 0; i < num; i++) {
            xVals.add( "小謝"+ i);
        }

        ArrayList yVals1 = new ArrayList();
        ArrayList yVals2 = new ArrayList();
        ArrayList yVals3 = new ArrayList();


        for (int i = 0; i < num; i++) {
            float val = (float) (Math.random() * num);
            yVals1.add(new BarEntry(val, i));
        }

        for (int i = 0; i < num; i++) {
            float val = (float) (Math.random() * num);;
            yVals2.add(new BarEntry(val, i));
        }

        for (int i = 0; i < num; i++) {
            float val = (float) (Math.random() * num);
            yVals3.add(new BarEntry(val, i));
        }

        // create 3 datasets with different types
        BarDataSet set1 = new BarDataSet(yVals1, "一季度");
        // set1.setColors(ColorTemplate.createColors(getApplicationContext(),
        // ColorTemplate.FRESH_COLORS));
        set1.setColor(Color.rgb(104, 241, 175));
        BarDataSet set2 = new BarDataSet(yVals2, "二季度");
        set2.setColor(Color.rgb(164, 228, 251));
        BarDataSet set3 = new BarDataSet(yVals3, "三季度");
        set3.setColor(Color.rgb(242, 247, 158));

        ArrayList dataSets = new ArrayList();
        dataSets.add(set1);
        dataSets.add(set2);
        dataSets.add(set3);

        BarData data = new BarData(xVals, dataSets);
        // data.setValueFormatter(new LargeValueFormatter());

        // add space between the dataset groups in percent of bar-width
        data.setValueFormatter(new CustomerValueFormatter());
        data.setDrawValues(true);
        data.setValueTextColor(Color.BLACK);
        data.setValueTextSize(13);
        data.setGroupSpace(80f);//設置組數據間距
        //data.setValueTypeface(tf);

        mChart.setData(data);
        mChart.animateXY(800,800);//圖表數據顯示動畫
        mChart.setVisibleXRangeMaximum(15);//設置屏幕顯示條數
        mChart.invalidate();
    }

    @Override
    public void onValueSelected(Entry e, int dataSetIndex, Highlight h) {
        Log.i("Activity", "Selected: " + e.toString() + ", dataSet: "
                + dataSetIndex);
        Toast.makeText(this, e.getXIndex()+"valu"+e.getVal()+e.getData(),
    }

    @Override
    public void onNothingSelected() {
        Log.i("Activity", "Nothing selected.");
    }
}
MyMarkerView .java
package com.charts.xh.mpandroidcharts;

import android.content.Context;
import android.widget.TextView;

import com.github.mikephil.charting.components.MarkerView;
import com.github.mikephil.charting.data.CandleEntry;
import com.github.mikephil.charting.data.Entry;
import com.github.mikephil.charting.highlight.Highlight;
import com.github.mikephil.charting.utils.Utils;

/**
 * Custom implementation of the MarkerView.
 *
 * @author Philipp Jahoda
 */
public class MyMarkerView extends MarkerView {

    private TextView tvContent;

    public MyMarkerView(Context context, int layoutResource) {
        super(context, layoutResource);

        tvContent = (TextView) findViewById(R.id.tvContent);
    }

    // callbacks everytime the MarkerView is redrawn, can be used to update the
    // content (user-interface)
    @Override
    public void refreshContent(Entry e, Highlight highlight) {

        if (e instanceof CandleEntry) {

            CandleEntry ce = (CandleEntry) e;

            tvContent.setText("" + Utils.formatNumber(ce.getHigh(), 0, true));
        } else {

            tvContent.setText("" + Utils.formatNumber(e.getVal(), 0, true));
        }
    }

    @Override
    public int getXOffset(float xpos) {
        // this will center the marker-view horizontally
        return -(getWidth() / 2);
    }

    @Override
    public int getYOffset(float ypos) {
        // this will cause the marker-view to be above the selected value
        return -getHeight();
    }
}
MyMarkerView 布局文件 custom_marker_view.xml
Y軸線數據格式化 MyYValueFormatter .java
package com.charts.xh.mpandroidcharts.com.charts.xh.utils;

import com.github.mikephil.charting.components.YAxis;
import com.github.mikephil.charting.formatter.YAxisValueFormatter;

import java.text.DecimalFormat;

public class MyYValueFormatter implements YAxisValueFormatter {

    private DecimalFormat mFormat;

    public MyYValueFormatter() {
        mFormat = new DecimalFormat("###,###,###,##0");
    }

    @Override
    public String getFormattedValue(float value, YAxis yAxis) {
        return mFormat.format(value);
    }
}
Gradle 依賴
repositories {
    maven { url "https://jitpack.io" }
}

dependencies {
    compile 'com.github.PhilJay:MPAndroidChart:v2.2.5'
}
如果用的Eclipse只需要將jar包拷貝到項目libs目錄下,即可開發是用MPAndroidCharts庫,點擊下載jar包
mChart.getAxisLeft().setEnabled(false) //隱藏Y軸左邊軸線,此時標簽數字也隱藏
mChart.getAxisRight().setEnabled(false) //隱藏Y軸右邊軸線,此時標簽數字也隱藏
如果想隱藏軸線但是想顯示數字標簽:
mChart.getAxisRight().setDrawAxisLine(false);
mChart.getAxisLeft().setLabelCount(8, false);//此時設置了分8個,可根據自己喜好設置
YAxis leftAxis = mChart.getAxisLeft();
leftAxis . setPosition(YAxisLabelPosition.OUTSIDE_CHART);/ /顯示軸線內部INSIDE_CHART
leftAxis.setAxisLineColor(Color.parseColor(“#ff0000”));//設置軸線顏色:leftAxis.setAxisLineWidth(1);// 設置軸線寬度
leftAxis.setTextSize(20);//設置y軸標簽字體大小
leftAxis.setTypeface();//設置自定義字體
leftAxis.setDrawGridLines(Boolean );//設置是否顯示網格線,
import com.github.mikephil.charting.components.YAxis;
import com.github.mikephil.charting.formatter.YAxisValueFormatter;

import java.text.DecimalFormat;

public class MyYValueFormatter implements YAxisValueFormatter {

    private DecimalFormat mFormat;

    public MyYValueFormatter() {
        mFormat = new DecimalFormat("###,###,###,##0");
    }

    @Override
    public String getFormattedValue(float value, YAxis yAxis) {
        return "¥"+mFormat.format(value);
    }
}
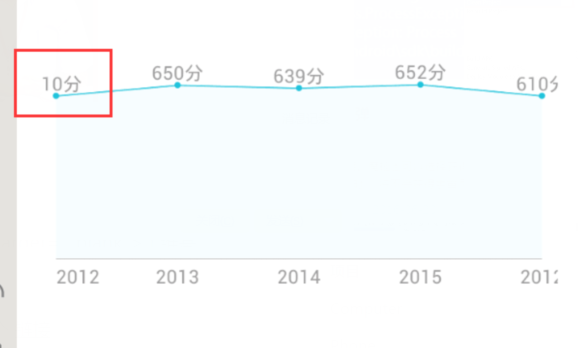
mChart.setExtraLeftOffset(float);
mChart.setExtraTopOffset(float);
mChart.setExtraRightOffset(float);
mChart.setExtraBottomOffset(float);

mChart.setExtraOffsets(float left, float top, float right, float bottom);//此種方法可以一次設置上下左右便宜。根據自己數據哪個地方顯示不全,對應調用方法
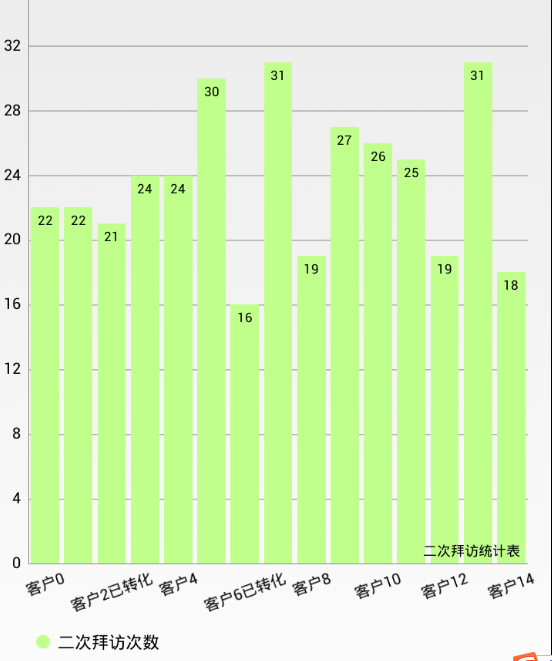
import com.github.mikephil.charting.data.Entry;
import com.github.mikephil.charting.formatter.ValueFormatter;
import com.github.mikephil.charting.utils.ViewPortHandler;

import java.text.DecimalFormat;

public class CustomerValueFormatter implements ValueFormatter {

    private DecimalFormat mFormat;

    public CustomerValueFormatter() {
        //此處是顯示數據的方式,顯示整型或者小數後面小數位數自己隨意確定
        mFormat = new DecimalFormat("###,###,###,##0");
    }

    @Override
    public String getFormattedValue(float value, Entry entry, int dataSetIndex, ViewPortHandler viewPortHandler) {
        return mFormat.format(value);//數據前或者後可根據自己想要顯示的方式添加
    }
}
注:百分比源碼自帶PercentFormatter,當然上面自定義可以定義你任何想要的方式。
XAxis xl = mChart.getXAxis();
xl.setLabelRotationAngle(-20);//設置x軸字體顯示角度
xl.setPosition(XAxisPosition.BOTTOM);//設置X軸的位置TOP, BOTTOM, BOTH_SIDED, TOP_INSIDE, BOTTOM_INSIDE
xl.setSpaceBetweenLabels(int spaceCharacters)//設置Lable之間的距離(字符),小於距離將不顯示,需要放大圖標才能看到
data.setDrawValues(false);//隱藏數據
data.setValueTextSize(20f);//設置字體大小
data.setValueTypeface(mTf);//自定義字體
setValueTextColor(int color)//設置字體顏色
setValueTextColors(List colors)//可設置多種顏色
 vcq9o6zI58nPzby1xDG6zTKjujwvcD4NCsno1sMxvOS+4A0KPHByZSBjbGFzcz0="brush:java;">
BarDataSet set1 = new BarDataSet(yVals1, "DataSet");
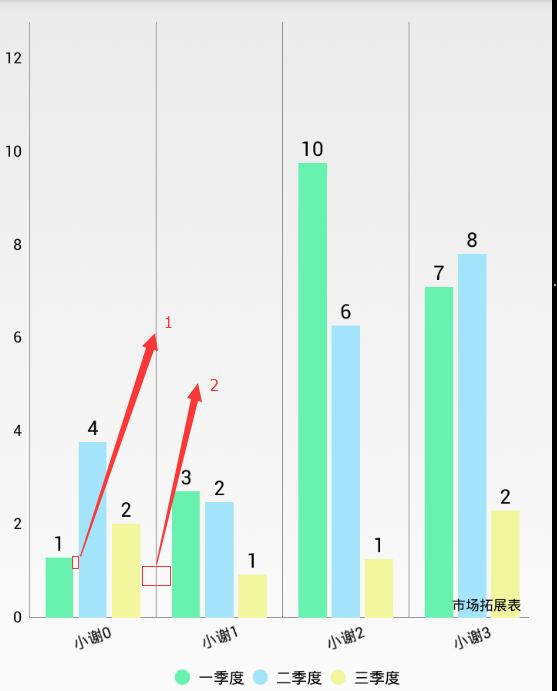
set1.setBarSpacePercent(50f);
設置2間距
data.setGroupSpace(float);//設置一頁顯示的數據條數,超出的數量需要滑動查看:
所以設置間距要看你的數據,及設置的是哪個間距,只有調用對應的方法間距才能生效。由於這個間隔設置是按百分比的,如果數據較多用戶體驗會很差,可以適當配合問題10設置一頁顯示的數量,可美觀界面。
//設置一頁顯示的數據條數,超出的數量需要滑動查看:
mChart.setVisibleXRangeMaximum(int);//需要在設置數據源後生效
Legend l = mChart.getLegend();
//l.setEnable(false);//不顯示圖例,默認true 顯示
/**圖例位置的枚舉類有下面幾種:
    RIGHT_OF_CHART, RIGHT_OF_CHART_CENTER, RIGHT_OF_CHART_INSIDE,
    LEFT_OF_CHART, LEFT_OF_CHART_CENTER, LEFT_OF_CHART_INSIDE,
    BELOW_CHART_LEFT, BELOW_CHART_RIGHT, BELOW_CHART_CENTER,
    ABOVE_CHART_LEFT, ABOVE_CHART_RIGHT, ABOVE_CHART_CENTER,
    PIECHART_CENTER
*/
l.setPosition(LegendPosition.RIGHT_OF_CHART_INSIDE);//設置圖例的位置
l.setTextSize(10f);
l.setFormSize(10f); // set the size of the legend forms/shapes
l.setForm(LegendForm.CIRCLE);//設置圖例形狀, SQUARE(方格) CIRCLE(圓形) LINE(線性)
l.setWordWrapEnabled(true);//此方法影響性能,盡量不用,默認是fasle的
第一次寫博客,由於水平有限可能有一些理解不是很深刻,可能有很多不足的地方,希望大家指正,本文是出於自己學習的目的,做一些記錄,當然如果對大家有幫助在下實在榮幸。
注:寫博客好難啊…真佩服那些經常寫博客的大神。
 android仿音悅台頁面交互效果實例代碼
概述新版的音悅台 APP 播放頁面交互非常有意思,可以把播放器往下拖動,然後在底部懸浮一個小框,還可以左右拖動,然後回彈的時候也會有相應的效果,這種交互效果在頭條視頻和一
 Android無線開發的幾種常用技術綜述
本文由阿裡巴巴移動安全客戶端、YunOS資深工程師Hao(嵌入式企鵝圈原創團隊成員)撰寫,是Hao在嵌入式企鵝圈發表的第一篇原創文章,對Android無線開發
 Saving Android View state correctly
Saving Android View state correctlyToday we will talk about saving and restoring View
 神奇的 Swift 錯誤處理
Swift 中的錯誤處理從 O-C 沿襲而來,但 Swift 1.0 之後逐漸發生了巨大改變。重要的改變發生在 Swift 2,它率先使用了“處理非異常的狀態